CRD Heat Map Shows remarkable difference in temperature between natural and built environments.
The results have major consequences.
By Sasha Izard
March 23, 2026
The CRD’s Regional Heat Map shows a stark difference in temperature between natural and built environments.
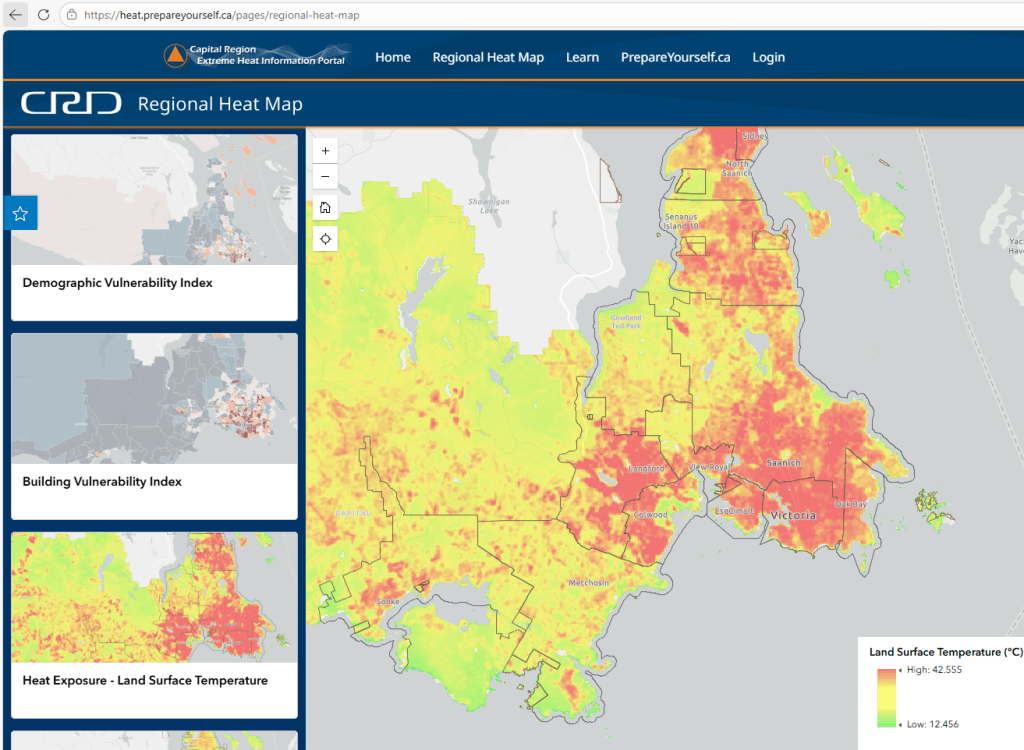
A closer look:
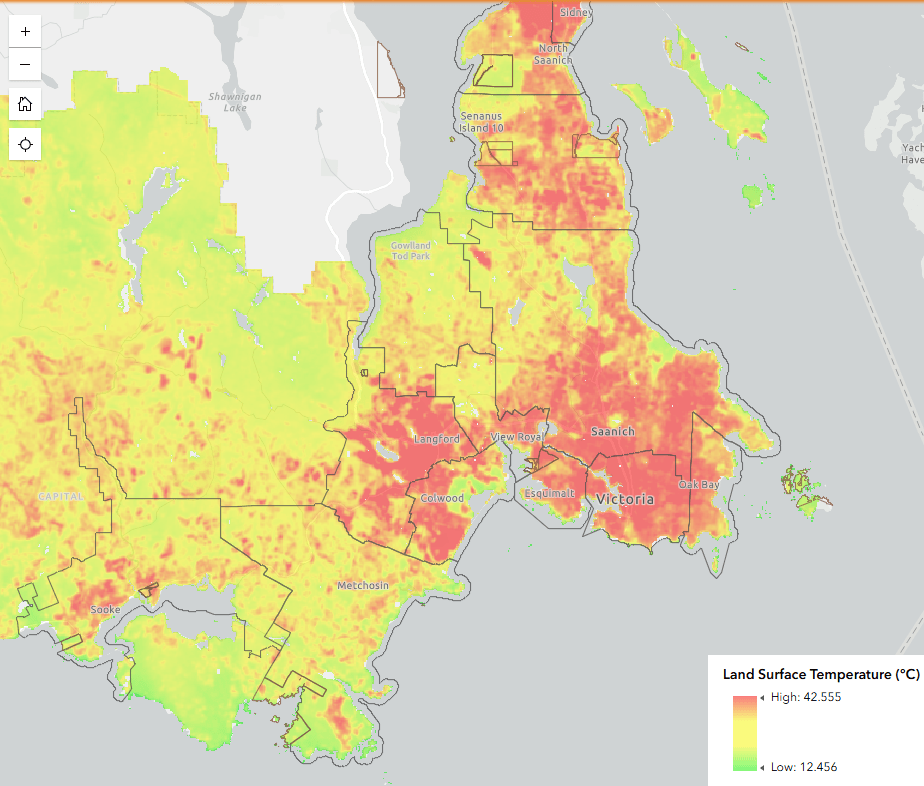
The first thing that becomes very apparent is high density in terms of built environment and low nature, not surprisingly correlates to much higher surface temperatures.
This is also apparent with the Building Vulnerability Index which reflects human vulnerability to extreme heat:
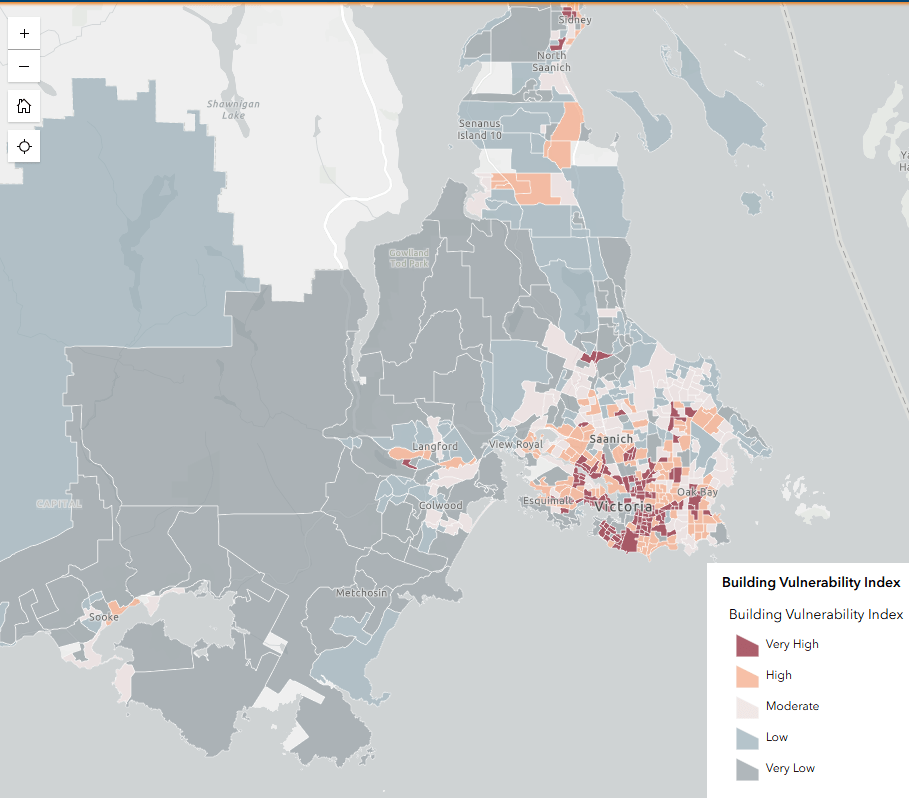
Not surprisingly, the higher the density of the built environment correlates to higher vulnerability to heat.
Yet, the push from the development industry and all levels of government has been for higher density in the built environment.
619 people lost their lives during the 2021 heat dome in British Columbia. 18 of those were in the Greater Victoria area. How many lives could be saved by better urban planning in the region that takes heat into account?
Sources:
BC Gov News Ministers’ statement on 619 lives lost during 2021 heat dome
Summer heat dome resulted in 18 Greater Victoria deaths: BC Coroners Service | Victoria News
—————————————————————————————————
I sent the following email to the CRD (March 23, 2026):
Hello,
I was looking at the CRD’s heat map, which shows a remarkable difference in the temperatures of natural and built environments. I am wondering if the CRD has a strategy for preventing increase in temperatures across the region?
Thank you,
Sasha Izard
—————————————————————————————————
Index of CRD Watch articles concerning the environment/ecology. – CRD Watch Homepage

Leave a comment